What Wearables and AI Can Tell Us About Rett Syndrome Severity
Over the last decade there has been a surge in the use of both medical-grade and consumer-grade wearable devices that measure an individual’s physiology. Consumer devices have remained almost exclusively in the area of sleep and fitness, although recently some of the giants of technology, like Apple, Google/Fitbit, and Samsung, have made some very preliminary steps towards cardiovascular health. The potential is enormous -- with hundreds of millions of these devices in circulation, the ability to monitor our own activities and health seems to be at hand (forgive the pun).
However, these devices (and the algorithms that the companies use to measure our "health") have been designed for the average consumer, who is mostly healthy, with few cardiac problems, and relatively normal sleep and physiology. The underlying raw data they used to compute the "metrics" of health (like "sleep efficiency" or "steps") are hidden from the consumer. This is partially to help extend battery life and save memory, and partly to protect the "proprietary" interests of the company. Worse still, the devices can be updated by the manufacturer without warning, changing the way the metrics are calculated. Finally, the wrist isn’t a great place to measure health -- it’s a long way from most organs, and arm motion doesn’t tell you much about most health issues. Unfortunately, these issues mean that only the manufacturer of the wearable can ever recalibrate the device to work on populations that don’t look like your average consumer. Often, there’s little incentive to do this when the potential market isn’t large.
More promisingly, there has been an explosion in higher-quality, medical-grade wearables, based on adhesive electronic patches. The application of these devices in health has largely been in the domain of basic cardiology to screen for arrhythmias (1). While not as convenient to wear as consumer-grade devices, these patches, which are slightly larger than a bandaid and stick on the skin, provide high-quality diagnostic data and can be worn for days, or even weeks.
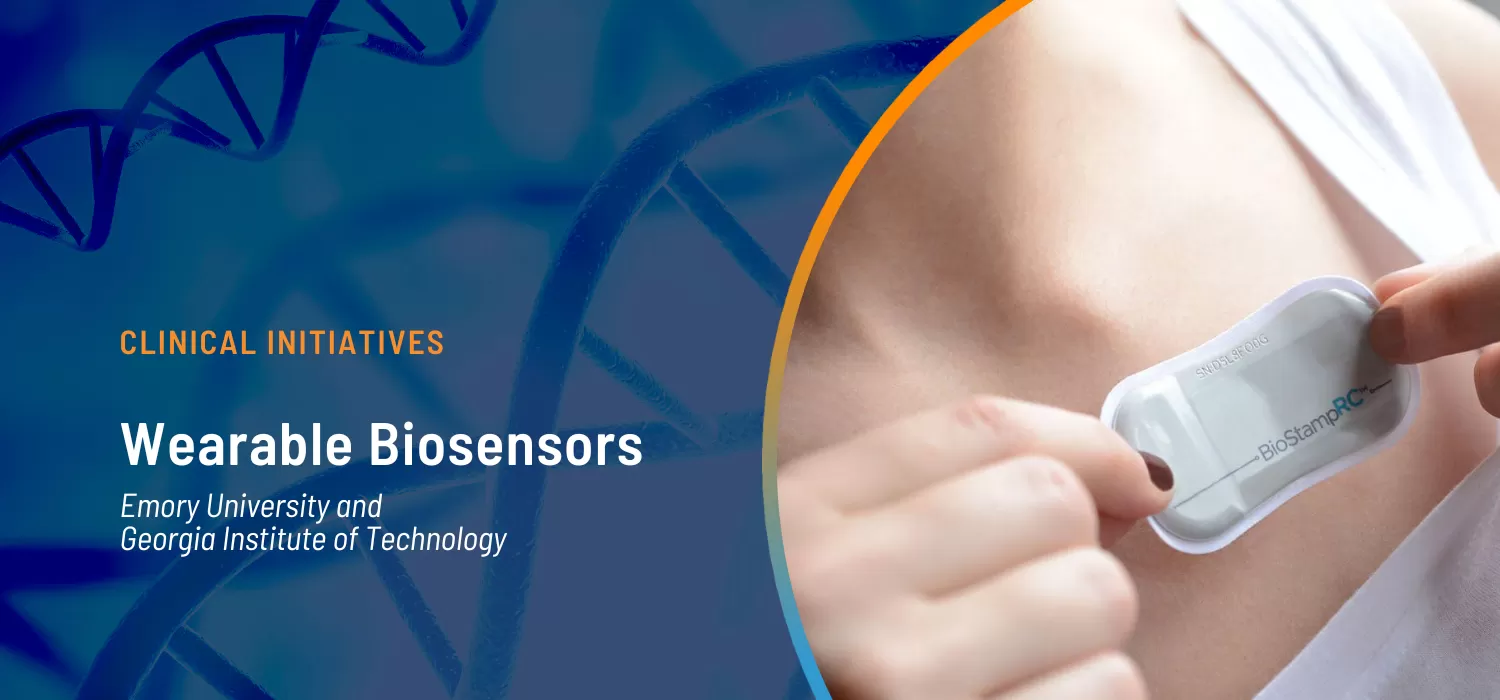
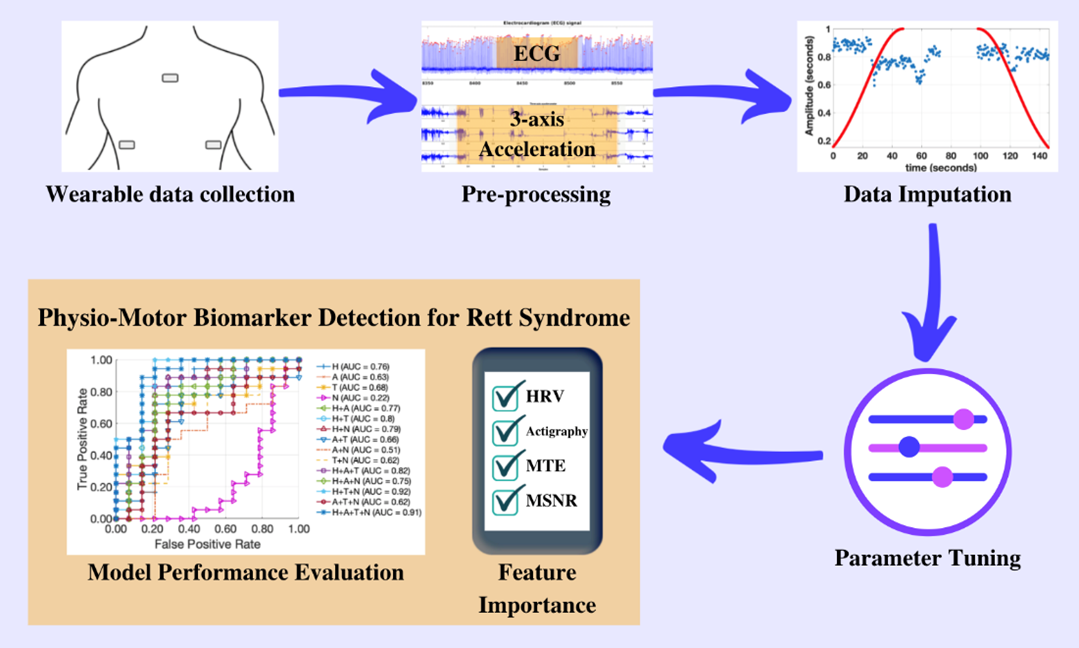
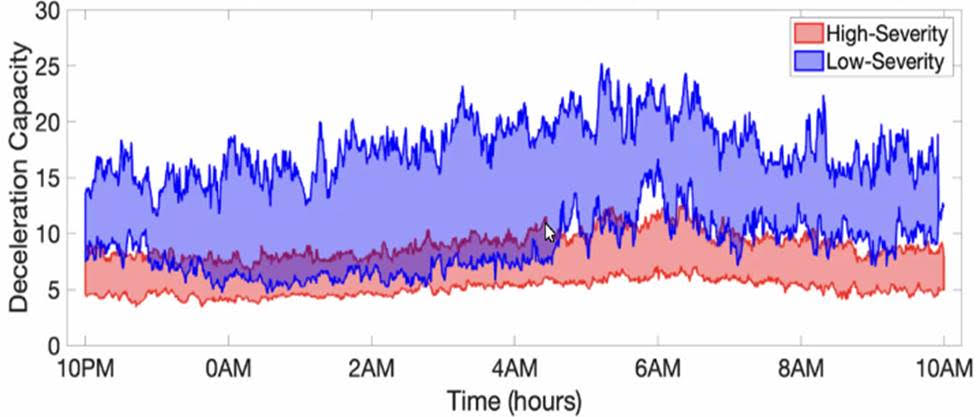
In our recently published work sponsored by the Rett Syndrome Research Trust, my research team at Emory University and the Georgia Institute of Technology used one of these patches (the MC10 Biostamp, pictured above) to analyze the movement and cardiac activity from 20 Rett syndrome study participants for 48 hours. By applying artificial intelligence (AI) to the data, we were able to identify patterns in physiology and movement that were specific to Rett syndrome severity (as measured by the Clinical Global Impression Severity score). In particular, we found three specific patterns in the movement and heart rate over a two-day period that allowed us to accurately identify the level of severity 84% of the time. These three distinctive patterns were: heart rate variability; randomness of activity; and, most importantly, the way in which these two variables interact. In earlier work, my team showed that the interaction of heart rate and activity was fundamental in identifying stress-induced changes. (2)(3)(4)
It turns out that changes in movement often lead to changes in heart rate (such as when we exercise). That is, we start to move a lot and the consequential demand for more oxygen leads to an increase in heart rate. However, when we are mentally stressed, changes in heart rate often precede changes in movement. That is, we experience cognitive stress, and then become agitated. Over the day, the strength and direction of the coupling between activity and physiology changes. By quantifying both the magnitude and directionality of this "signaling" in the autonomic nervous system (the system that changes heart rate and breathing in response to stress signals), we were able to build a very strong measure of symptom severity in another disorder. In this new work applying the approach to Rett syndrome, where autonomic nervous system function is disrupted, and recently published in PLoS One, we showed that it has the potential to provide an objective and continuous measure of symptom severity in this population. This means that by wearing a patch for 48 hours, it may be possible to measure Rett syndrome severity, or changes in Rett syndrome severity, day by day or in response to a treatment to see if it’s working. This could be very important for clinical trials.
RSRT has generously provided us with additional funding to validate this work in additional studies of Rett syndrome individuals, an essential step in the development of any novel biomarker. As a reminder, a biomarker is something you measure that gives you information about the state of health or a condition in an individual. For example, blood pressure is a biomarker for cardiovascular health, and blood glucose levels are a biomarker for diabetes. If successful, this new biomarker presents an exciting opportunity to identify the efficacy of therapies for Rett and for any individual, potentially allowing personalized treatment. This effort is part of a larger initiative by RSRT to develop direct and objective measures of symptom severity in Rett syndrome.
Importantly, my team also demonstrated that our approach is extremely robust to noise and missing data. It is common for large parts of the recording to have missing sections (because the patch was removed) or simply be too noisy to analyze (because the subject was moving too much). By implementing a novel technique called surrogate imputation, which picks the most representative data from the rest of the recording to fill in the missing periods, we showed that as much as half the recording could be missing or corrupt before it affected the performance of our approach.
Read the press release from Emory University.
___________________________________________________________
(1) Although increasingly, blood glucose monitors to help diabetic patients to fine tune insulin administration and "earables" (to measure brainwaves from inside the ear) provide promise to sufferers of epilepsy to titrate antiepileptic and antiseizure drugs.
(2) Osipov M, Behzadi Y, Kane JM, Petrides G, Clifford GD. Objective identification and analysis of physiological and behavioral signs of schizophrenia. J Ment Health. 2015;24(5):276-82
(3) Reinertsen E, Osipov M, Liu C, Kane JM, Petrides G, Clifford GD. Continuous assessment of schizophrenia using heart rate and accelerometer data. Physiol Meas. 2017 Jun 27;38(7):1456-1471
(4) Reinertsen E, Shashikumar SP, Shah AJ, Nemati S, Clifford GD. Multiscale network dynamics between heart rate and locomotor activity are altered in schizophrenia. Physiol Meas. 2018 Oct 30;39(11):115001.
(5) Suresha P, et al. Rett syndrome severity estimation with the BioStamp nPoint using interactions between heart rate variability and body movement. PLoS One, March 2023.
References
- Reinertsen E, Shashikumar SP, Shah AJ, Nemati S, Clifford GD. Multiscale network dynamics between heart rate and locomotor activity are altered in schizophrenia. Physiol Meas. 2018 Oct 30;39(11):115001.
- Reinertsen E, Osipov M, Liu C, Kane JM, Petrides G, Clifford GD. Continuous assessment of schizophrenia using heart rate and accelerometer data. Physiol Meas. 2017 Jun 27;38(7):1456-1471
- Osipov M, Behzadi Y, Kane JM, Petrides G, Clifford GD. Objective identification and analysis of physiological and behavioral signs of schizophrenia. J Ment Health. 2015;24(5):276-82
- Suresha. PB, O’Leary. H, Tarquinio. DC, Von Hehn. J, Clifford. GD, Suresha P, et al. Rett syndrome severity estimation with the BioStamp nPoint using interactions between heart rate variability and body movement. PLoS One, January 2023.
- Cakmak AS, et al. Classification and prediction of post-trauma outcomes related to PTSD using circadian rhythm changes measured via wrist-worn research watch in a large longitudinal cohort, IEEE Journal of Biomedical and Health Informatics 25 (8), 2866-2876
- MC10 Biostamp nPoint patch available from. [Web-link] https://www.mc10inc.com/ (now https://www.medidata.com/ )
